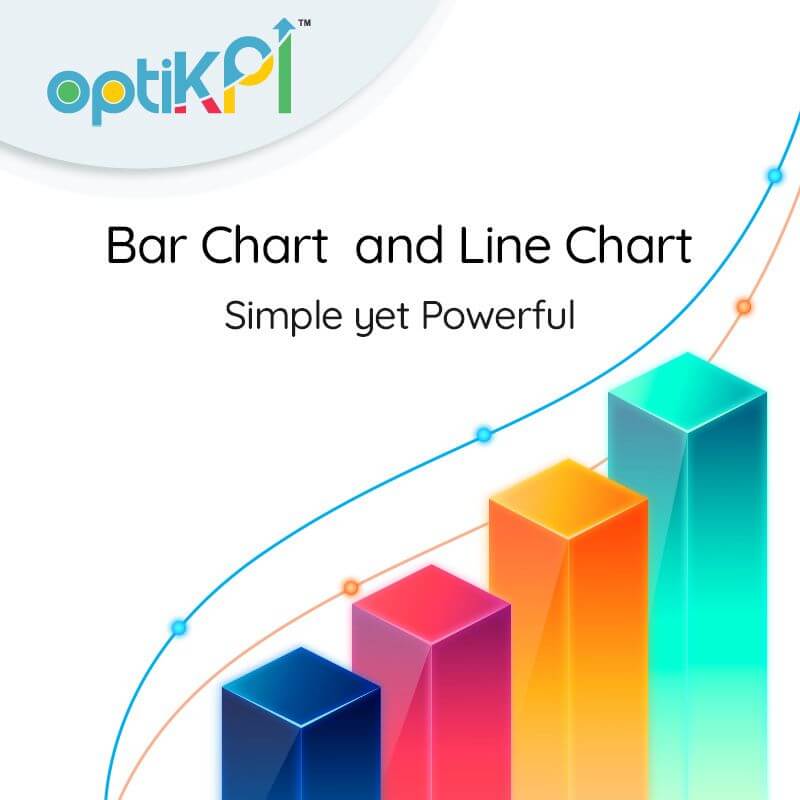
Bar Charts help clarify trends & estimate key values at a single glance while Line charts help you to quickly tell the range, minimum / maximum or anomalies such as gaps or clusters easily. OptiKPI has integrated these charts into its dashboard for providing an in-depth understanding of your existing data which will help you shape your future more effectively.
For example: Bar Charts can be used to get insights on the weekly registration trends, app downloads trend and Line Charts for analysing last login or first time deposit’s trends.
 Elevating Player Satisfaction: The Science of Personalization and AI in iGaming
 From Data to Strategy: How Marketing Automation Transforms iGaming Campaigns
 The Best iGaming CRM for Unprecedented iGaming Success
 Mastering Customer Segmentation and Targeting
 Multi-Channel Marketing in iGaming: Strategies for Success
 How to increase customer lifetime value in iGaming: Top 5 key strategies
 Winning Marketing Campaign for Your Online Gaming Site (How to Set Up)
 How to Prevent Online Gaming Frauds
  3 Successful Strategies for Improving Your Deposit Rates
 4 best practices to optimize the conversion rate of first-time deposits: Part 2
 Multi-Channel Marketing platform for online casino and gambling sites
 How to run a successful online casino?
 4 differences between customer acquisition and customer retention in Gaming
 How to Promote Online Gaming Sites?
 4 Reliable Marketing Strategies for your Gaming Business
 Evolution in the online gaming industry
 Digital Marketing for the Gaming Industry
 5 Best Gaming Marketing Campaigns ever
 Use Case: how to double your FTD conversion rates?
 Best Player Onboarding Strategies for Smooth Conversions on Gaming Platforms
 6 Ultra Effective Strategies for Referral Marketing
 5 Effective Stages of Marketing Funnel for Gaming Operators.
 6 Highly Effective Call to Action Buttons for iGames
 A complete guide to marketing your mobile game app
 Bulk Messaging for the Gaming industry
 7 best practices to optimise conversion rate of first time deposits
 Online Gaming Marketing
 OptiKPI: Meet our Talents (Episode #5)
 OptiKPI: Meet our Talents (Episode #4)
 OptiKPI: Meet our Talents (Episode #3)
 OptiKPI: Meet our Talents (Episode #2)
 OptiKPI: Meet our Talents (#1st Episode)
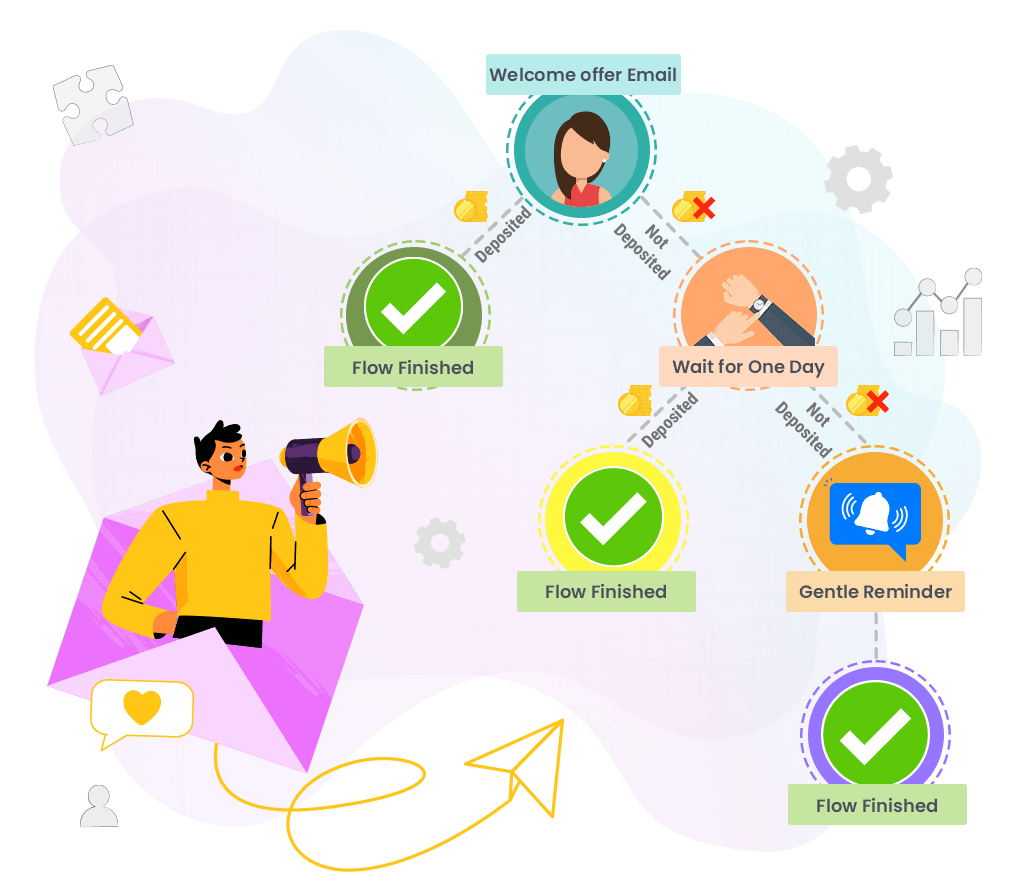 OptiKPI: Journey Builder Feature
 Get to Know OptiKPI: Who We Are?
 OptiKPI Actions. What is it?
 Use Case: How OptiKPI helps you to acquire new players
 Use Case: How OptiKPI helps you to engage players
 Types of Actions in OptiKPI engine.
 10 Key Elements Influencing Casino Players' Loyalty
 3 best customer loyalty programs for gaming operators
 How to boost customer loyalty for online casino: 100% successful strategy from OptiKPI
 How to increase daily active users on your online gaming platform?
 How to increase customer retention in your online casino or sports betting site?
 9 highly effective churn rate prevention strategies
 Bonuses in real-time: automated and based on player's behaviour
 Use Case: Real-time Bonus offers for players who are about to drop
 Automated birthday greetings to your players
 SMS Marketing for Online Gaming
 What are the types of push notifications?
 Send Push Notifications to Your Players
 How Push Notifications help in Conversions
 Push Notifications in Customer Engagement
 What are push notifications?
 Push Notifications in Customer retention
 OptiKPI. When do we use SMS campaigns?
 OptiKPI. When do we use Push Notifications?
 Push notifications for the Gaming Industry
 How Player Journey helps your Online Casino business?
 Player Reactivation Journey - Bring your Players Back to Site
 User Journey in Retention Strategies for Online Games
 How segmentation works in OptiKPI
 Manual Marketing vs. Marketing Automation in Gaming Industry
 Real-time Marketing
 3 benefits for gaming operators by real-time marketing platforms
 Player Journey Gaming
 Taking advantage of player behaviour
 Marketing automation in Gaming Industry: why, how and what for?
 What is a 3rd party provider? Why do we use them?
 Customer Data Platform
 How to succeed in the Online Gaming Industry?
  What actually does marketing automation do?
 How to acquire a New Player?
 User Login: the art of greeting players in real-time
 A day in the life of a Customer Support Manager
 Use Case: Failed Deposit
 Use Case: Player’s balance around 0
 Yay! It’s a Big Win! or Automatic alerts case
 Player Registration: welcome your new users right off the bat
 Cards or Segments? That is the question. Chapter 2
 Cards or Segments? That is the question. Chapter 1
 Actions. Why do we need it?
 Dolly the sheep. What is the "clone" feature?